There are so many ways you can analyze the unstructured data that makes up conversation on the Internet.
Some of the most prevalent include metrics like sentiment – was that post positive or negative?
The right tools let you dive much deeper than this to uncover trends in emotions, users’ demographics, and more.
Below are three media intelligence metrics that we’ve found especially insightful recently – plus examples to match from three brands you know and love.
1. Post Volume
Post volume shows the total number of posts, comments, articles and general conversation over a set period of time.
While the total volume of conversation about a topic can be insightful, it’s when you look for trends related to months of the year, days of the week, or times of day that you can really learn something useful.
This can come in handy when you’re deciding on a campaign launch date or finalizing your editorial calendar.
Need to cool off? Here’s an example with Rita’s Italian Ice!

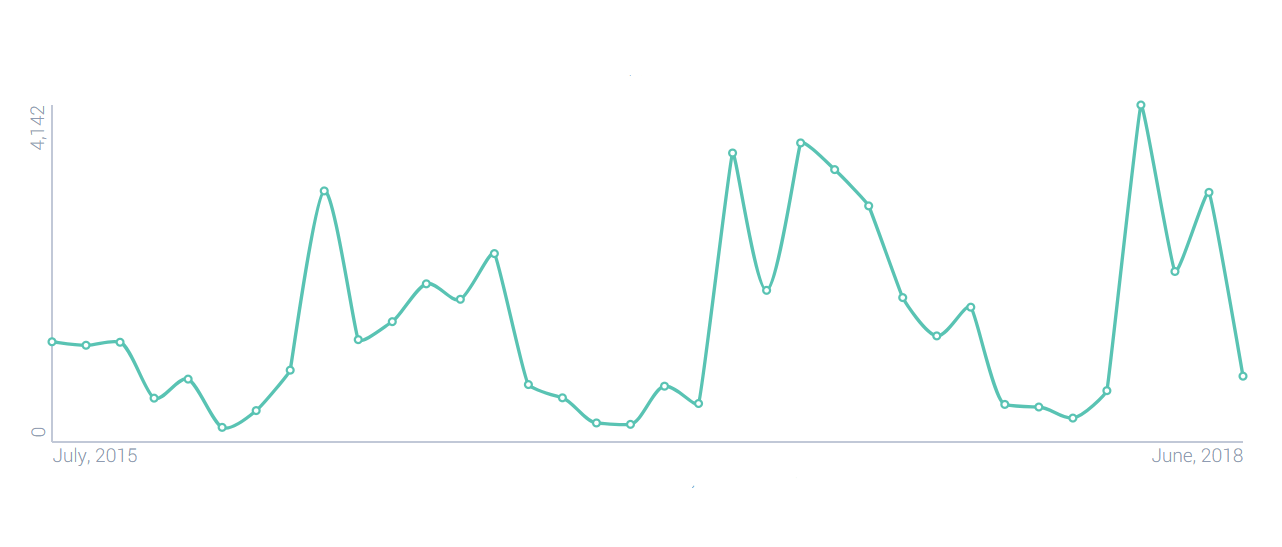
Above you’ll see that conversation about Rita’s consistently picks up during the spring and summer months.
What if we looked at conversation by day of the week as opposed to month of the year? We were willing to bet that Rita’s generated more conversation on the weekends. Surprisingly, though, we found that Saturday and Sunday are seeing the fewest number of Rita’s mentions, shown below.

Maybe Rita’s will come out with a #RitasWeekender campaign as a result!
2. Themes
Themes are predefined categories that conversation around your topic can be grouped into. Posts, comments, and articles are grouped based on specific words and phrases used.
Typical themes include taste, such as someone talking about how “delicious” dinner was or how they hated the new chip “flavor,” or acquisition, such as someone talking about a “preorder” of theirs or the fact that they’d just “bought” something at the mall.
There’s often the ability to define your own categories as well, so you’re able to, for example, determine how much conversation is going on about acoustic guitars versus electrics guitars or iced versus cold brew coffee.
Let’s face it. The excitement never ends when it comes to Apple’s releases! Here’s an example of themes using conversation around Apple’s iPhone X.

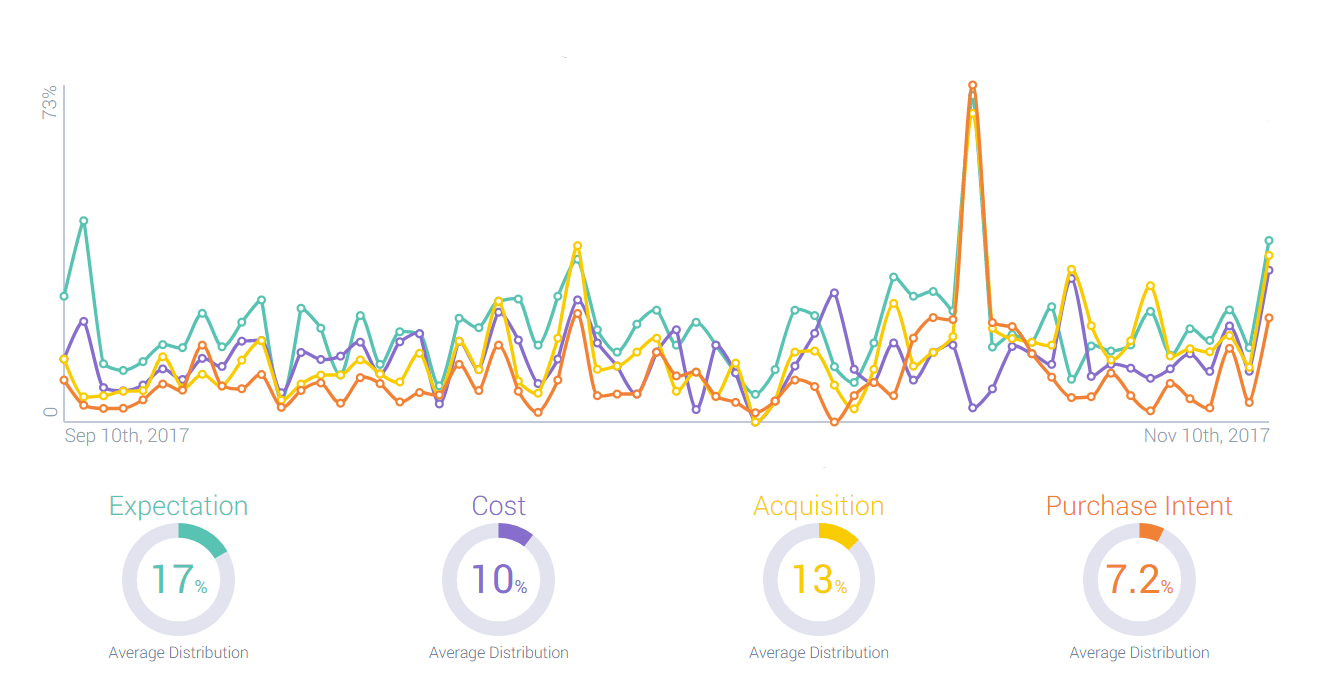
As shown above, conversation about user’s expectations for the iPhone X as well as their intent to purchase or their recent acquisition of an iPhone X all spike around the phone’s release last November.
Conversation about the cost of the phone rose and fell along with the other themes in the months leading up to the phone’s release. While we would have guessed that posts and comments gawking at the cost of the phone would have spiked on its release date, conversation related to this theme actually dipped to one of its lowest points that week.
We have no doubt Apple took advantage of that hype!
3. Interests
Interests highlights other lifestyle categories that users who mention your topic mention as well. What else interests those that are interested in you?!
This can be viewed in two ways:
You can look at the percentage of all users who mention your topic, who also discuss this topic. Is it overwhelming or just a select few?
You can also look at how many more times as likely some users are to discuss this new topic as compared to the general population. The higher the ratio, the stronger you can assume that interest is.
Both analyses are insightful, and if you find a topic that’s high in both, you know it’s worth digging into further!
Missing your beloved hockey team? Here’s an example around the NHL.

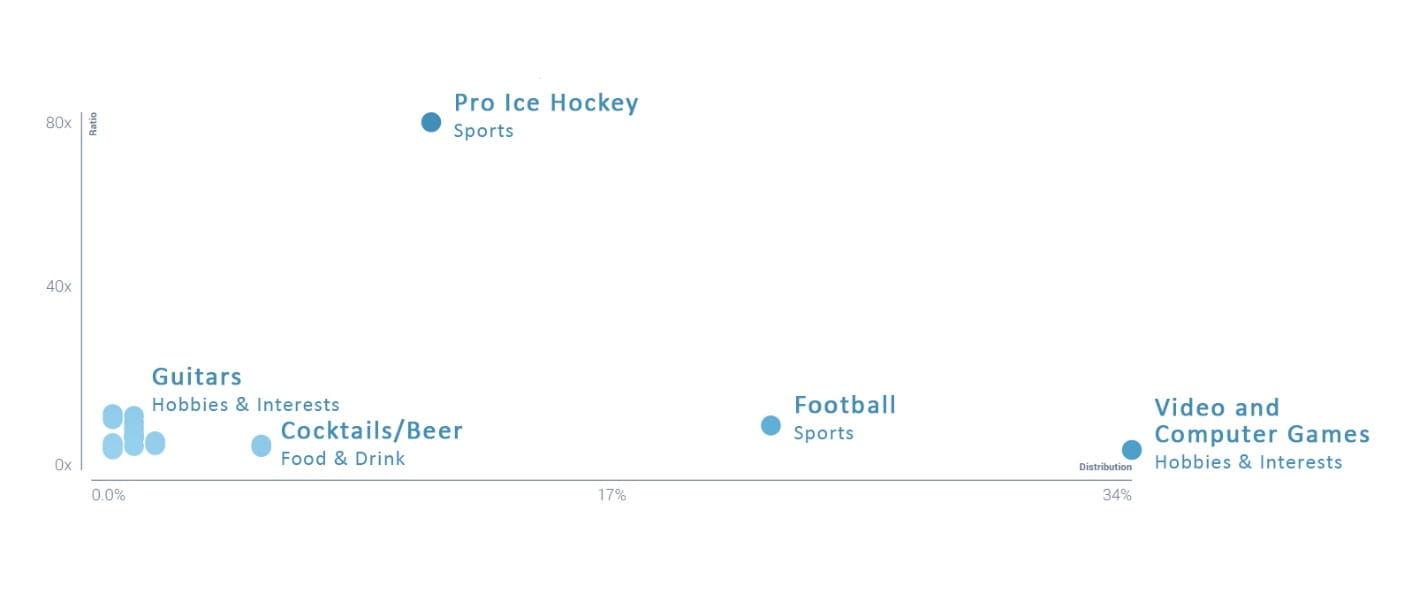
Some of the biggest interests of those talking about the NHL include video games, football, and beer. That’s no surprise!
But notice how those who talk about the NHL are also 6.6x more likely to talk about guitars.
After further investigation, the NHL might determine that’s a new campaign or partnership opportunity!
What might you uncover if you looked at these metrics as they related to your brand? Contact us to talk about working media intelligence for your own brand!

